By Dan Collins, Chief Architect, PEAK6 Capital Management
Having been in software long enough to work across industries and with a variety of distributed systems, I know every system has its day. Software and systems engineers create performance requirements, latency constraints, and sweat the details on software quality. Their hard work ensures retail sites stay online through black Friday, ad campaigns survive the Super Bowl, accounting systems make it through tax season, and media sites stay up to date during the election. And that’s not even counting safety systems we rely on each day, like the systems that keep our hospitals, vehicles, and industries humming.
Last week was record-setting for the financial markets. We saw a few days in the top-ten all time value traded in equities ($791B), as well as Thursday and Friday this week in the top 15 days ever on volume in equities. If you are a software or hardware engineer in Fintech, most likely you’re seeing greater processing volume and much higher than average usage of your systems. Market volume, volatility, and events like the 4.4% one-day point drop in the Dow, the highest ever, have had cascading impacts across calculation, analytics, risk, portfolio accounting, and pretty much every system that touches the markets. If you are lucky enough to work with real-time market data, this was (hopefully) a defining week that really showed what your systems can do. If not, this was a week that should make it easy to justify addressing gaps and taking action on your lessons learned.
Better, Continuously
At PEAK6 Capital Management, we’ve been in the options markets and successful for over 22 years. Last week’s market activity highlighted not only the collaborative environment we have between our trading desk and engineering, but was also a testament to the continuous evolution of our trading systems. These systems allow us to provide liquidity, increase market flow, and carry risk when our counterparties need it most. They do this by giving our traders a view of the markets, a view of our positions, and the ability to analyze and act on opportunities as conditions change.
To make sure we keep getting better, our product and engineering teams push on technical initiatives. Adopting infrastructure as code, updating our service mesh, coordinating nightly processing with Apache Airflow, unifying streaming data pipelines using Apache Kafka, and leaning on Kubernetes for scheduling have made it easier than ever to scale, deploy, and quickly adjust to changing demands on our systems. That’s not to say we don’t run into issues or occasionally exit the market when our risk checks deem it necessary. Rather, we’re continually learning and continually making our systems more resilient, better able to meet demand.
Great systems are built on a clear understanding of their nonfunctional requirements, including availability, usability, maintainability, extensibility, and scalability. Our systems are built for low-latency (in the millis) market analysis and trading strategy execution. We are not a high-frequency trading platform and by making this distinction, we have a bit more flexibility choosing between our systems’ maintainability and scalability. However, as you’ll see in the numbers below, we still love our metrics and understanding exactly how our systems are performing.
So, what do record setting market conditions look like for an options trading platform?
Record Setting, Unprecedented
To understand how last week went for our systems, it’s necessary to understand historic market values. The following chart shows all previous market selloffs with number of days from peak to 10% drawdown. The drop last week moved ridiculously fast and took only six days!
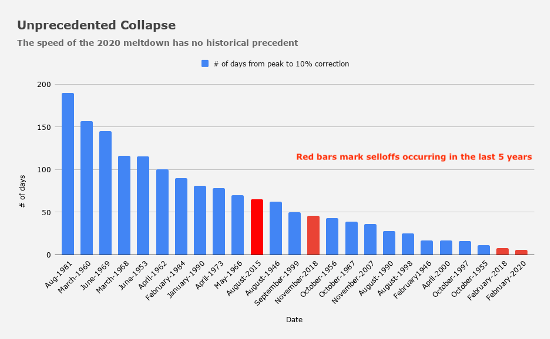 Source: Heisenberg Report, Nomura’s Charlie McElligott
If we look at the S&P 500 (SPY), we can see the free fall (left) and overall SPY traded on Friday (right) was the highest it has ever seen (104.27B).
 Source: left – SPY OHLC on TradingView, right – Bloomberg
Option markets’ volumes both by notional value and number of contracts show a similar picture. The following two charts below show how options volume compared to previous weeks.
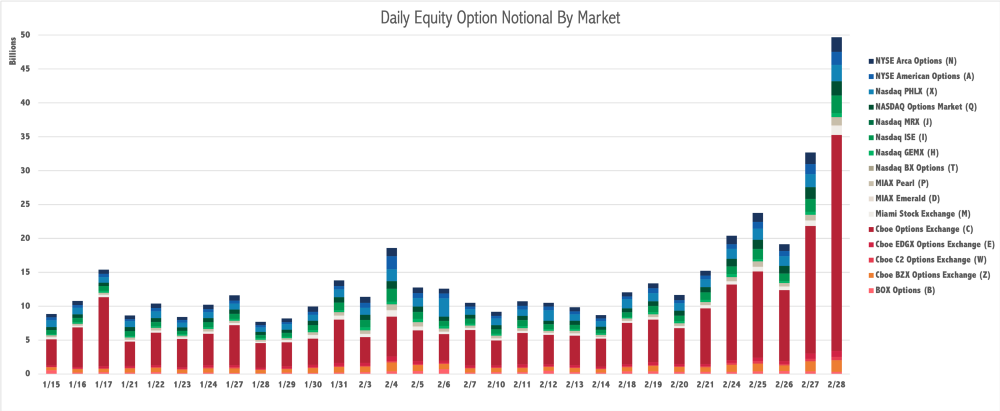 Source: Cboe Exchanges, Inc.
The above notional by market shows a small jump Tuesday around $25B with giant leaps in notional Thursday ($34B) and Friday ($50B). The below contracts by market shows a marked increase beginning on Friday the 21st moving from ~30 million to just over ~40 million contracts.
 Source: Cboe Exchanges, Inc.
Record-setting volume like this is not seen often and, as we’ll see below, it puts our systems to the test.
A Rising Tide Lifts… Our Data Processors?
Looking across our trading platform, the first and most obvious place we saw impact were across our market data feeds. These run daily receiving tick by tick data for options’ quotes and trades. If we look back through October 2018, we see a fairly consistent messages per day between ~25 and ~50 billion. Starting in late January, however, you start to see rates increase with huge peaks for the last week well over 75B messages per day culminating in over 101B messages per day processed on Friday. And this is only our options data. It doesn’t count our CTA and UTP stock data integrations.
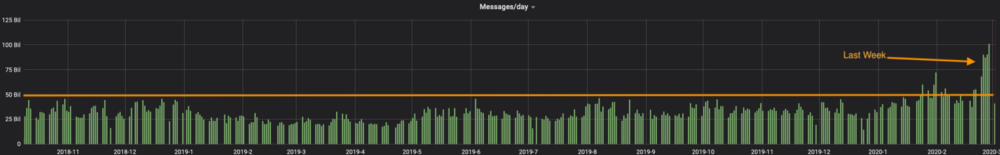 PEAK6
PEAK6
As this market data moves downstream, we calculate derived data like prices, greeks, and user-defined calcs. These get pumped into the tools our traders use to get a real-time view of the markets. You can see the impact from the CPU load on our data daemons, especially on Tuesday, when one of these nodes bounced and our scripts rebalanced.
 PEAK6
PEAK6
As more volatility means more opportunity, our execution systems also experienced sustained bursts generated both by our trading desk and recalculation events for risk checks and fill rates as we went out to the market. This meant more reactive processing end to end throughout each day.
After trading hours, all of this data and all these trades need to go through clearing where nightly processing will kick out final settlements, positions, and reports that will fuel analysis for the coming day. These systems also had to deal with the huge volume, and we saw not only delayed processing from our data vendors, but also increased load on our realtime, archiving and nightly data summarization. For example, on a normal week, we might process ~5 TB per day tick data, but last week we had ~8 TB per day.
Integration Stress
As I mentioned above, our data vendors were also impacted. Some quick highlights in the wild here were NYSE Arca Resolves Delays in Trades Reported to the OCC and Toronto Exchange Closes Early Due to Technical Issue. Additionally, Cboe and other firms put out notices that their systems may be overloaded. Here’s a short except from the Cboe warning:
Cboe Global Markets Inc. is warning market participants that massive volumes in S&P 500 weekly options are getting close to overloading its software system. The exchange sent an email to market participants indicating that it has exceeded 90% capacity in its market data feed that enables the streaming of weekly S&P 500 option quotes as of 2:57 p.m. in New York, and would send another email once the 95% threshold is breached.
Preparing for a Marathon a Sprint at a Time
Here are a few ways we prepared to keep our software running during these all-time highs.
- Our systems are designed for high-availability by default including an active-active configuration that allows us to quickly move traffic from our trading users in the case of localized failure. (See Kevin’s blog post on the Metro cluster as an example.)
- Our systems are designed for quick redeployment and scale out meaning we could increase the number of replicas in Kubernetes to horizontally scale as well as create ad-hoc instances where necessary and have our service discovery rebalance usage.
- We are always tuning, especially during times of high pressure. In several cases, we tuned JVM behavior for our Java apps, investigated HyperThreading performance, and reconfigured our Kubernetes workers to better handle load (and occasionally dropped in some memory).
- We have automated alerting and log aggregation that make it easy for us to triage issues.
- We are risk-diligent, holding off on releases and constantly weighing the cost-benefit of rolling out updates. This means we might push out patches for critical issues, but wait on larger or less-critical updates.
- We have great processes and trust between our trading teams, trading support teams, and our engineering teams so that we can quickly de-escalate firm risk while reducing recovery time.
All of these preparations were the result of our product, trading, and engineering teams working together to ensure our systems were well-built for failure. Capabilities like redeployment, horizontally scaling, and failover aren’t emergent and need constant diligence to remain viable. We might not use all these capabilities as we have this past week, but knowing that we have them ensures we can remain stable and available when the markets push us to our limit.
Better, Faster, Stronger
In sharing this post, I hope you have a better understanding of how PEAK6 Capital Management builds systems and the kinds of stresses a trading platform can experience. If you’re in technology, I hope you can see the power of observability into your systems. It’s never too late to start measuring what you care about. It’s the only way you can make it better so that you understand how your systems perform, what your systems do under pressure, and what it might look like on your system’s record-setting day.