At PEAK6 Capital Management we operate a variety of different systems in support of our trading teams. As we improve and evolve these systems, we sometimes run into hurdles along the way that are not all that easy to diagnose. This is the story of one of these hurdles our systems and core team ran into that came about while updating our pricing system. So, relax, stay a while, and listen.
A Head-Scratcher
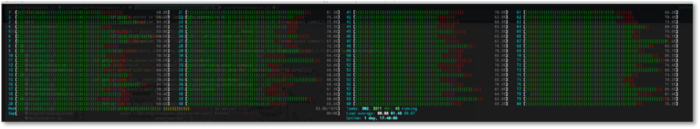
As you might expect, market data and pricing systems are central to our trading platform and they process a LOT of data (around 7MM messages/second or about 4TB/day) just for pricing (in aggregate, our systems can pump more than 30MM messages/second at 10Gbps). All this data is needed so these systems can give us visibility into market volatility, position risk, and liquidity. Additionally, even though we are not a high-frequency trading shop, our ability to create, monitor, and execute trading strategies relies on up to date market data and derived calculations like NBBO, the greeks, and others. So, imagine our surprise when a routine server hardware upgrade resulted in our high-performance pricing system using new processors like this in our test environments:
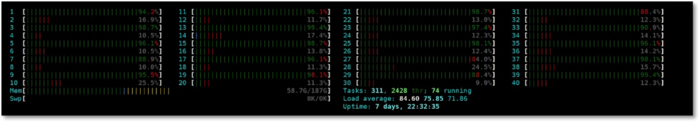
That ‘s right. Every. Other. Processor. Pegged‚Ķ ü§î. Thanks to our systems team, we put a pause on the rollout and started to dig in. Our goal being to ensure our pricing system was operating at least as good as it had been on the existing hardware and was taking advantage of better processors, memory, and bus speeds. So, the first order of business was to take a look at our existing rollout as we thought there might be something strange with this machine or that we might need to dig into thread-pooling and scheduling within the app. And that ‘s when we scratched our heads again. Our production environment had the same profile, every other processor pegged‚Ķ
HyperHerring
One possible explanation for the above behavior would be HyperThreading. HyperThreading is Intel ‘s implementation of simultaneous multi-threading in which each physical CPU has two threads available for execution in order to improve overall usage and throughput. When HyperThreading is enabled, each physical CPU will act as if there are two logical CPUs available and the logical CPUs will appear in tools like htop or lscpu. In the image below, you can see how HyperThreading is advertised and shown to impact execution, essentially reducing CPU idle time by packing in the two threads worth of work.
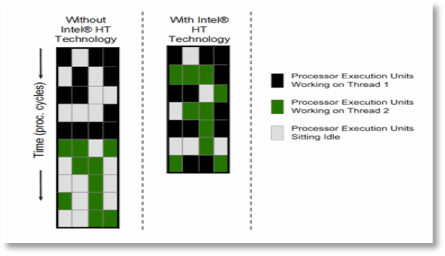 Image Credit
We ‘re running Intel Xeon Gold 6230s on the new hardware with 20 physical cores supporting 40 threads and Intel Xeon E5‚Äì2690s on the existing hardware with 14 physical cores supporting 28 threads. Given both processors come with HyperThreading enabled and we were seeing similar behavior, we decided to do an easy test by disabling HyperThreading and reviewing the behavior. SSH, reconfigure, reboot, and‚Ķ unfortunately we found we now have 20 CPUs with every other processor pegged. It was the same behavior with HyperThreading disabled.
At this point our engineers working on the pricing system started to question their sanity and began trying to reproduce in our testing environments. Easy enough, one variable down, let ‘s keep asking why and see if we can get to root cause.
Works on My Machine
After the shenanigans above, we went back to the development environment for our pricing system. Our development environments are used for testing functionality more so than performance or system utilization, but are great sandboxes. As we brought the system online, we saw the following profile (this is on a machine running two 6230s):
This shows the pricing system running across all 80 logical CPUs with fairly even distribution and is exactly what we ‘d expect the behavior to look like. There were a few sighs of relief seeing the expected behavior, but more than a few furrowed brows as we now wanted to know what was different between environments.
Pricing In A Box
I should mention that most of PEAK6 ‘s applications rely on Kubernetes and are containerized. Moving our standalone apps to containers and using an orchestrator like Kubernetes means that we have a common interface and application runtime across all of our systems. We have around 200 nodes across four geographically isolated data centers running around 1,500 applications at any given time. Additionally, as we have systems like pricing and use some low-level hardware features for things like shared memory and multicast, we do end up with some highly tailored Kubernetes configurations. These allow us to continue using the same tooling, monitoring, etc that Kubernetes gives us while fully taking advantage of all the hardware we have available.
Now, in our development environments, we typically launch applications outside of docker as we want to do local testing, debugging, etc, without building images. The down side is, we may run into differences in application behavior depending on whether the application runs locally or within docker. When we tested the pricing system in the development environment as shown above, we tested both natively and using a containerized version of the application. In both cases, the pricing system had a fairly even load distribution across CPUs. So this was another variable we could put to rest, … or so we thought.
7 Out of 5 Whys
Getting stumped while triaging software behavior isn ‘t a great feeling. If anything, computers are predictable as they only do as instructed. Although, there are many factors that make behavior non-deterministic, emergent, and difficult to understand. Kerninghan ‘s law, “debugging is twice as hard as writing code in the first place,” carries weight up and down the stack.
At times like these, the best thing you can do is go full detective and review your case notes. Let ‘s recap what we ‘ve seen so far:
- UAT pricing systems with new hardware show an every-other CPU load distribution
- Production pricing systems with existing hardware show an every-other CPU load distribution
- In UAT, the behavior is invariant to HyperThreading
- In Development pricing systems show even CPU load distribution natively and containerized
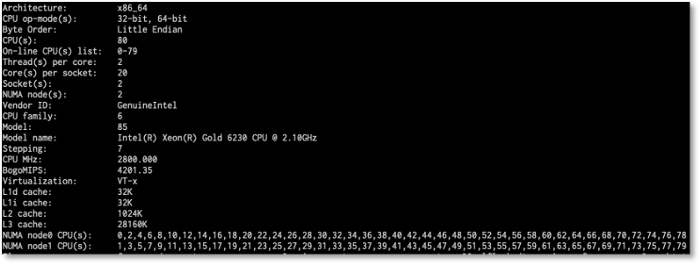
It was in reviewing the above, that we realized that in each case we saw every other CPU being utilized, it was always every odd or every even CPU. Why not all CPUs for specific processors? Why not just one processor? This led us to look more at the processor stats where we saw the following:
 Processor Stats
Does it jump out at you? Every other CPU either odd or even lines up with NUMA nodes!
NUMA and You
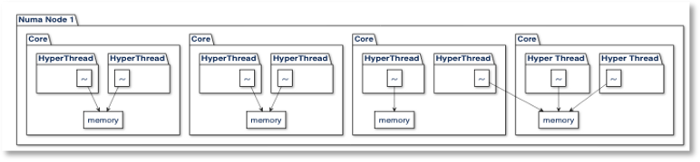
The first thing you need to know about NUMA is that it ‘s really neat. It ‘s a way for processors to use local memory as they multitask executing threads across processors on a system. As long as the same workloads end up being scheduled on the same cores, the memory will be locally available and execution time reduced. As an example, in a four-core system running with two threads per core, it might look like the following:
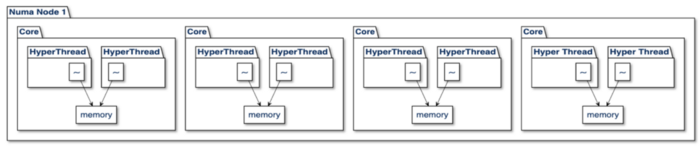
In cases where the scheduler moves a thread across cores and memory is no longer available locally, there is still fairly efficient access to the remote memory within the same NUMA node. In the worst-case scenario, a thread gets scheduled on a processor that has to cross from one NUMA node to another via an “interconnect”, which has the highest latency. On a Linux system, the completely fair scheduler (CFS) will attempt to allocate threads using a local node first. In the case a thread cannot be scheduled locally, the scheduler will migrate the thread, but will not necessarily migrate the memory, as seen below where core 2 reads across the bus remotely for memory that ‘s available locally for core 3.
Diving deeper, we used the numastat tool to get more info into how NUMA was performing and the trail got hot as we saw the following:
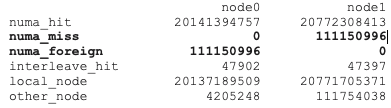
Here the numa_miss and numa_foreign tell us that our pricing system is running almost exclusively on node0. It also explains why threads running non-locally are not executing as efficiently and the workload is unbalanced. If we look at our dev environment, we see a much better profile:
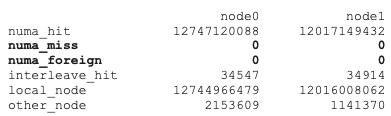
That ‘s no numa_miss or numa_foreign and almost 1:1 local_node memory use. This gets us to the root of the behavior being inefficient thread scheduling across NUMA-bound processors. However, it doesn ‘t explain why this was happening.
As a note, I ‘m simplifying here a bit as there ‘s more complexity with scheduling algorithms, balancing latency targets, time slicing, etc that can all be tuned and could all be their own posts.
Great Scott! It ‘s Kubernetes!
Me: Knock, Knock
You: Who ‘s there?
Me: Kubelet
You: Kubelet who?
Me: Kubelet gonna schedule all your containers ‘ threads randomly
Let ‘s recap the facts again:
- UAT pricing systems with new hardware show an every-other CPU load distribution
- Production pricing systems with existing hardware show an every-other CPU load distribution
- In UAT, the behavior is invariant to HyperThreading
- In Development pricing systems show even CPU load distribution natively and containerized
- UAT and Production systems show NUMA misses and CPU imbalances
- Development systems show no NUMA misses and no CPU imbalances
The last and final clue to our case came as we compared Kubernetes pod configurations between environments looking for any additional hints for why we ‘d see a pricing system in development work as expected while a Kubernetes scheduled pricing system in UAT or Production continue to show a CPU imbalance.
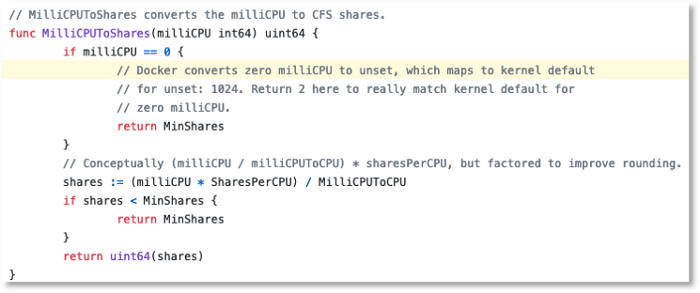
As it turns out, our pod configurations for the pricing system did not include any CPU requests in UAT or Production. This seemed benign, but it resulted in Kubelet (Kubernetes worker node orchestrator) assigning only the minimum cpu shares to our pricing system containers. You can see this in source here in the conversion to milli cpu to shares returning MinShares.
In production, we confirmed this by reviewing cpu.shares in the kubepods cgroup:
![]()
More Equal Than Others
Alright, you ‘re thinking. I get it, there were only two cpu shares defined for these containers, but what does that have to do with NUMA and CPU balancing? Here ‘s where we go all the way down the rabbit hole.
- Kubelet is configured to use the default CPU manager (essentially passing CPU assignment down to the OS(Linux))
- Kubelet configures the containers for the pricing system with no CPU limits and two CPU shares
- Kubelet also configures these containers for burstable quality of service, meaning no guaranteed reservations
- Linux, seeing the above, divides out available CPU across all CPUs based on any affinities that are set as well as memory stickiness, etc (but the pricing system doesn ‘t have any)
- Linux, then divides out all remaining CPU cycles to processes based on CPU shares (but the pricing system comes in at a much lower priority because of the CPU shares it ‘s been assigned).
- Threads for the pricing system end up running randomly across CPUs on the system and include performance hits for both migrating threads as well as migrating memory pages across NUMA nodes.
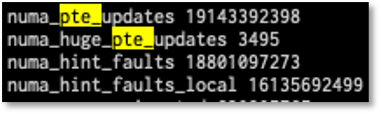
Further evidence of this behavior can be seen by checking out /proc/vmstat which shows us virtual memory statistics including numa_pte_updates and numa_huge_pte_updates. These show that we ‘re updating memory to be moved within the numa nodes around 19 Billion times and 3,495 for huge pages!
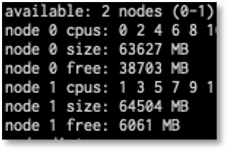
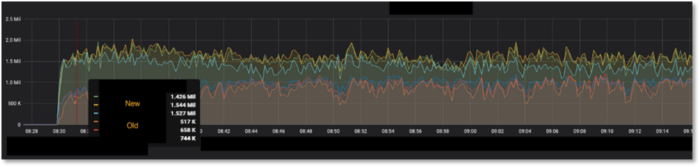
This random allocation also shows up in NUMA memory usage across nodes. Instead of a more equal distribution between each of the NUMA nodes, we end up with one node ~90% allocated while the other is closer to ~60%.
A One-line Solution
Simply adding a resources.requests.cpu: “70” to the pod configuration changes everything. It allows kubelet to properly hint that the pricing system ‘s threads will need compute, which results in more contiguous processor allocation and better memory locality in NUMA. This one-line change completely changes the pricing system behavior giving us better system saturation across all available resources.
First, we see CPU shares appropriately set at around 72k instead of 2.
![]() cpu.shares == 71680
cpu.shares == 71680
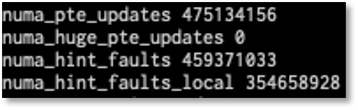
Reviewing our /proc/vmstat shows a much better profile, with no huge page table updates and ~475MM moves (compared with 19B before!).
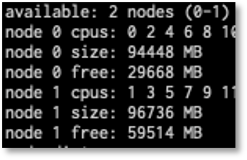
Additionally, the memory allocation is better balanced:
Finally, we see a much more even distribution across processors:
We ‘re rather lucky here as we see the Linux scheduler react nicely to the CPU request. Kubernetes versions continue to add better support for NUMA and CPU topology and assignment. If we were still running into issues after narrowing down CPU shares as the root cause, we could use the finer grained numactl controls or cpuset and memset configurations to continue to tweak the allocations. Thankfully, we don ‘t have to yet.
Outcomes
After applying our one-line fix for a CPU request, we watched our pricing system performance over the next few days in our UAT environment. The change not only corrected the CPU performance imbalance, but also resulted in about a 3x improvement in calculation speed along with a 75% reduction in overall calculation queuing during market spikes. Heck Yes!
Where to Go From Here
Hopefully you ‘ve gotten a taste of some of the complexity that comes with maintaining a high-performing pricing system. As we talked a little about CPU features like HyperThreading and affinity, NUMA and memory allocation, and Kubernetes, we also shared how our engineers worked together and triaged this issue from reproducing it to evaluating a fix. If you ‘re interested in diving into these kinds of problems or working on systems that really scale, check out our open positions. We ‘re always looking for passionate, curious engineers who like working on hard problems!